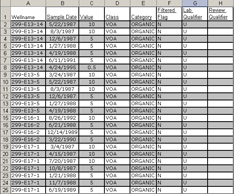
- Most project data is in tabular form
- Site workers spend hours to process each contaminant data
- Regulators, stakeholders, and decision makers routinely raise concerns about the difficulty of data interpretation in this format
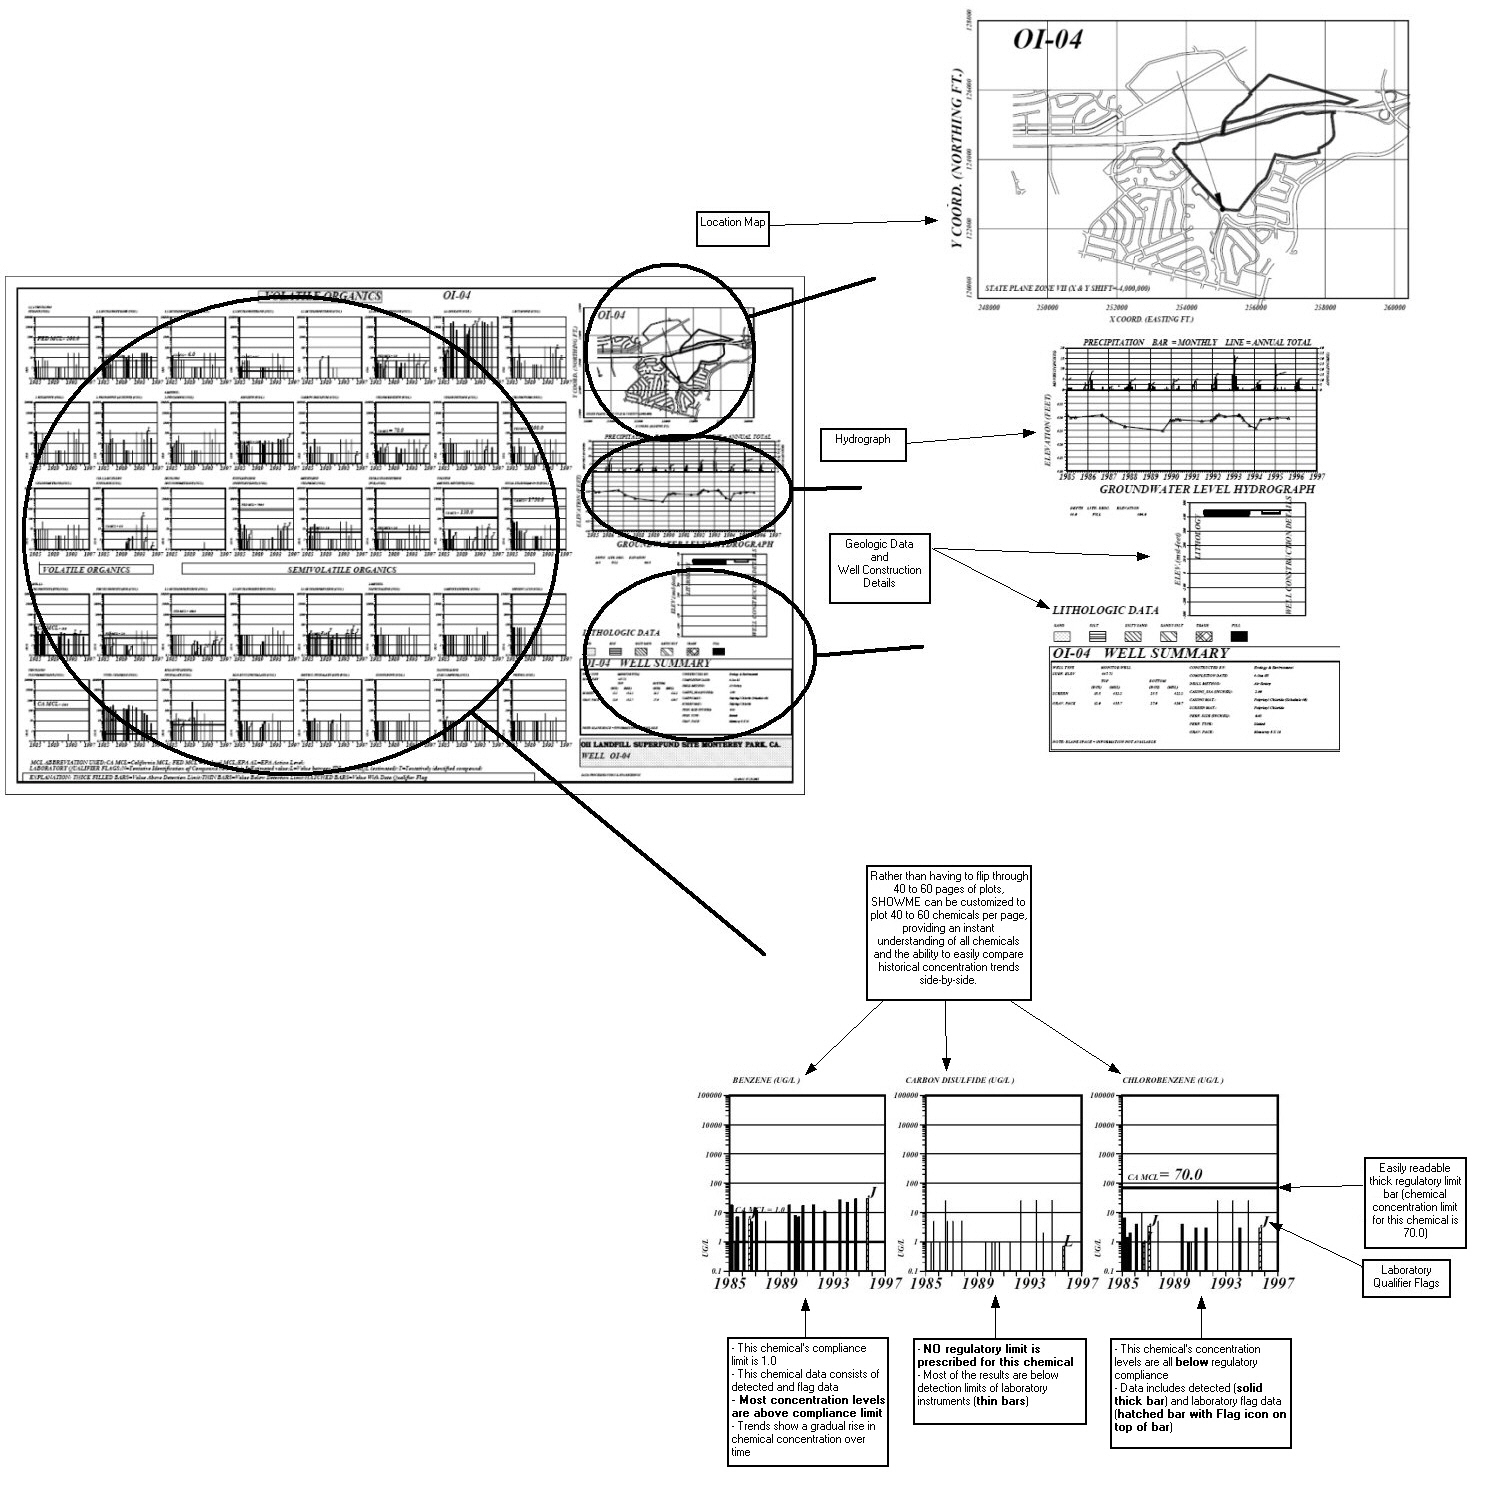
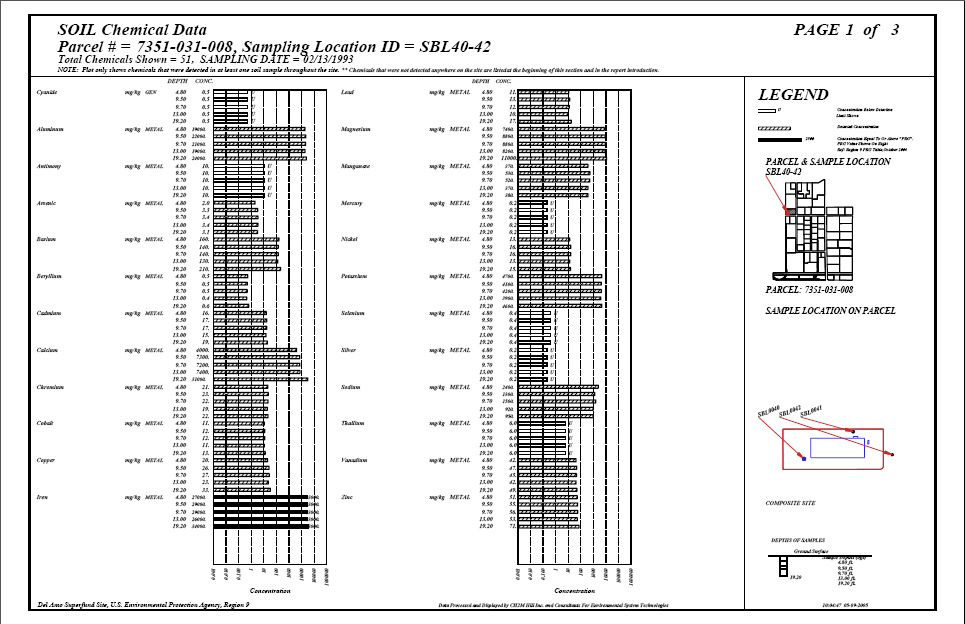
This is an illustrative sample page of a SHOWME template. This template was developed for EPA Region IX managers, site managers,stakeholders, and the concerned public.
Current Practice
SHOWME
Benefits of SHOWME
Manually extract data and generate plots using Excel or simple graphical tools
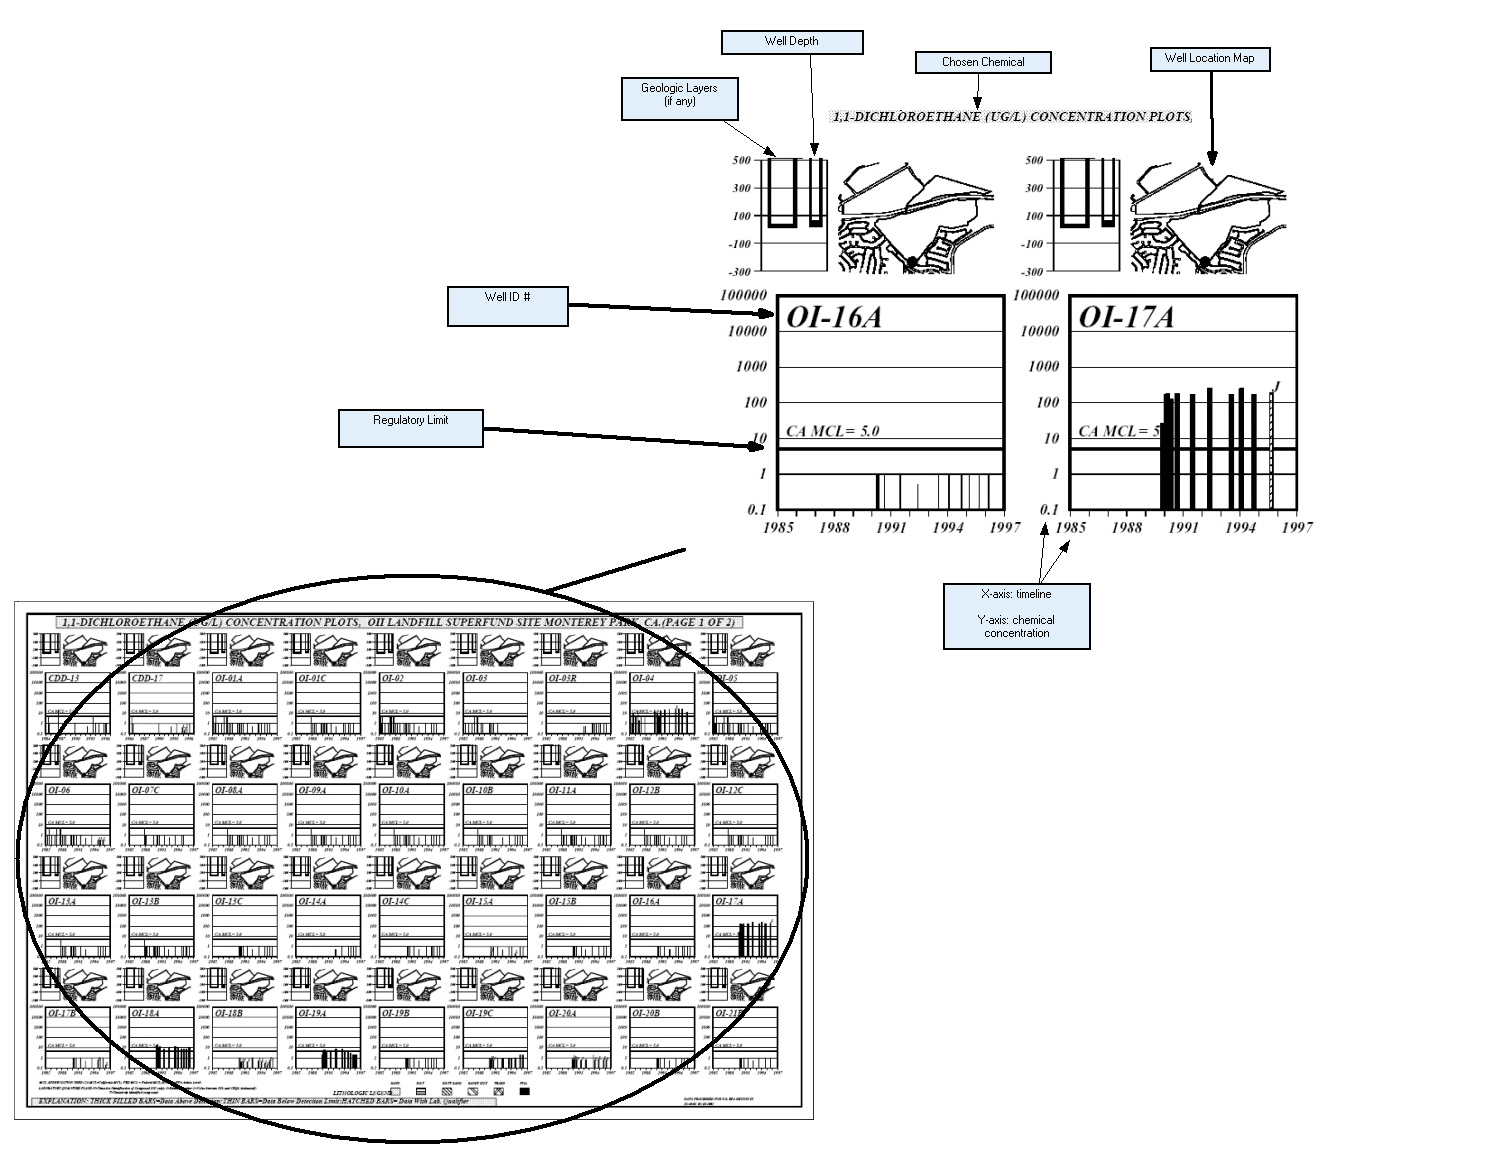
Automatically extract and generate bar plots with regulatory limit and laboratory flags
Allows for complete regulatory compliance evaluations
No well, geology, and location
details included
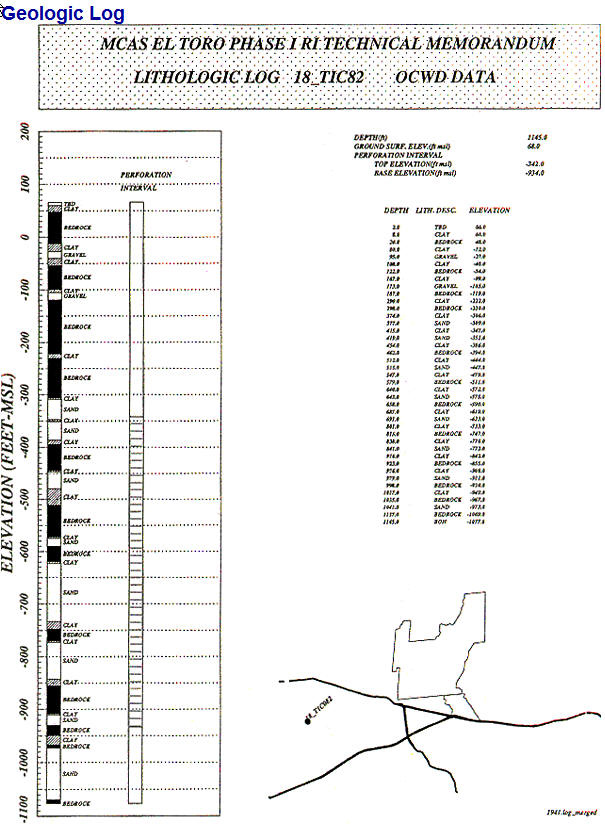
Each plot includes location map,
geology, and well plot
Provides all needed data for
contaminant evaluation
Water level and rainfall distribution are in separate files
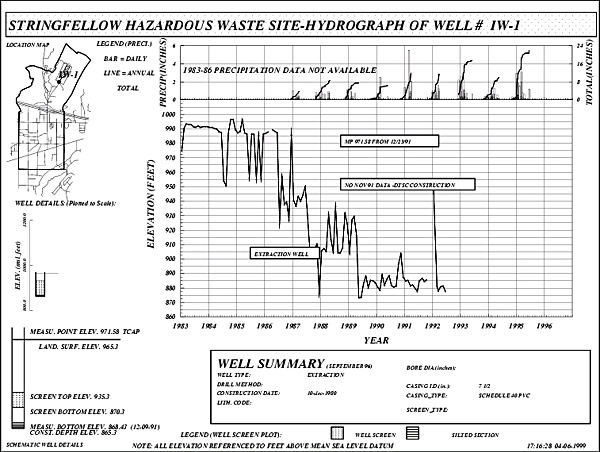
Plots include precipitation and
water level details
Provides efficient consolidation of key data
Each plot is developed and updated manually
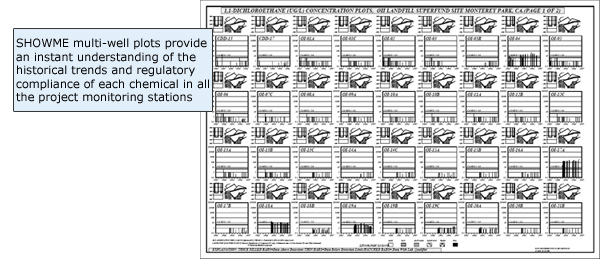
Thousands of plots are automatically generated in a matter of minutes
SHOWME interfaces with the most commonly-used commercial databases - Oracle, Excel, SQL, Access, etc - and builds from that, provides concise, informative plots
Single Well Plot
Thousands of plots can be generated quickly, and each printed 11x17 page can be custom-designed to include: Location Map, Hydrograph, Geologic Data, Well Construction Data. A Single Well Plot can graph up to 60 monitored chemicals in each project well. (click to see full-size image in new window)
The SHOWME program has been in constant growth and evolution for the past two decades in order to keep up with cutting edge computer technologies. Since its creation, it has been utilized in many major projects nationwide: