|
|
|
|
|
|
 |
|
|
|
Environmental Databases
Contains decades of monitoring data
Cumulative data records are in millions
Access of centralized stored databases is not easy
|
EDA key features and benefits
Needs no individual software licenses
Complex data access through internet browser
Custom designed interfaces with existing databases
Regulators, stakeholders and the public assess raw data
Advanced data users get latest data in “ready to use formats”
|
EDA at DOE Hanford Site
(One of the largest federal contaminated facility)
Processes every night approximately:
7,000 monitoring well information
Two million chemical records
125,000 water level data
Soil boring data
|
|
Back to Top
|
Back to Top
Ground Water Quality- EDA Dynamic Chemical Data Summary for the selected area and chemicals provides instant understanding of available data, number of detects; number of monitoring wells, and sampling duration.
Internet based sorting provides easy means for data users, stake holders, contractors, and site managers rearrange summary tables by any given table header.
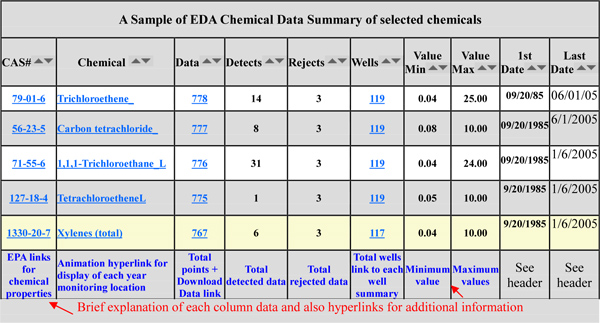
Back to Top |
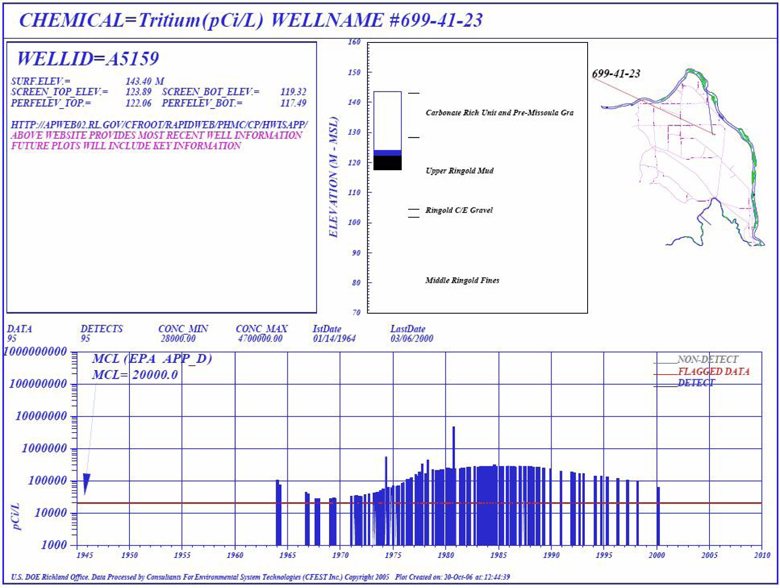
If you are data user, you are aware that the tabular data provided by most of
the sites need significant data processing.
EDA automatically generates concise informative plots of all chemicals to provide instant
understanding of data observed at each well.
|
 |
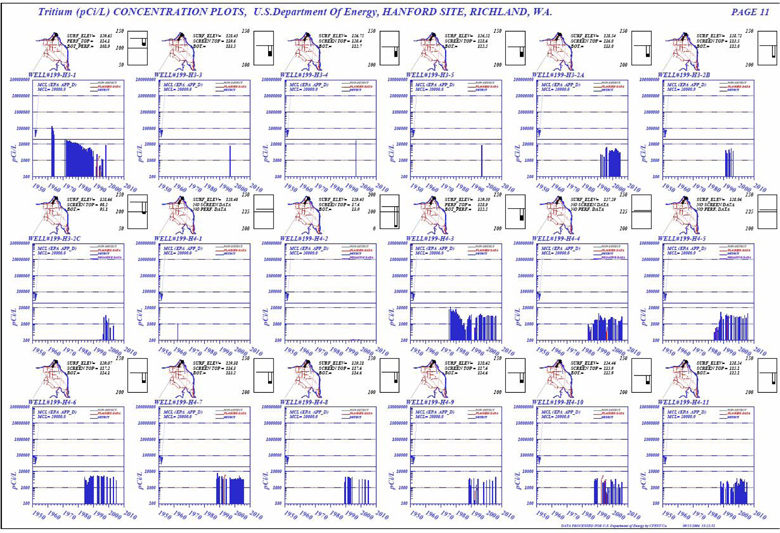
Each well plot of a chemical is for specific well data review. A quick review of a chemical data observed in all wells is also needed to understand its data status and temporal trends for the whole site. EDA provides multi-well plots for each chemical.
 |
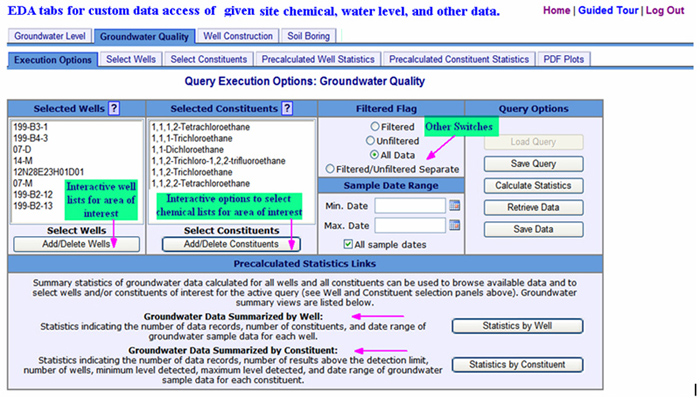
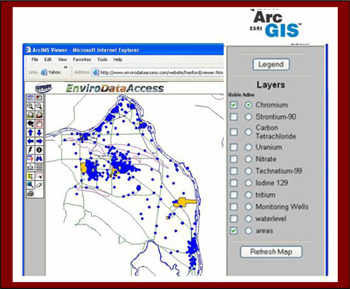
ArcIMS and MapGuide interfaces with the EDA summary tables and plots provides interactive means to develop custom maps, navigate to area of interest, select chemical of interest, and interactive generate informative summary
tables and plots.
|
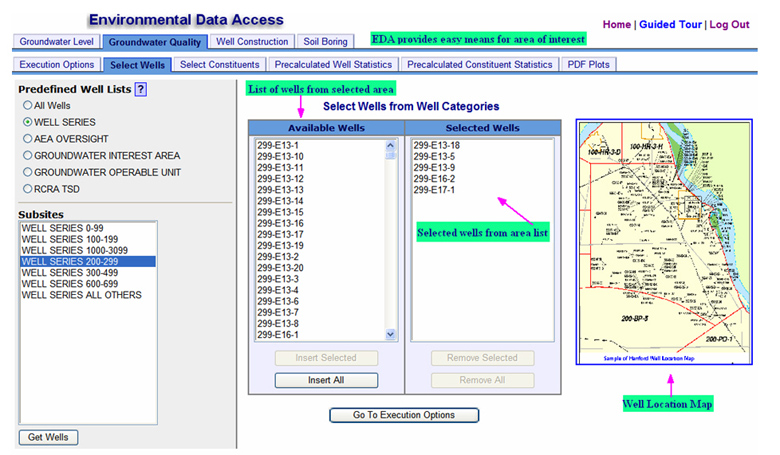
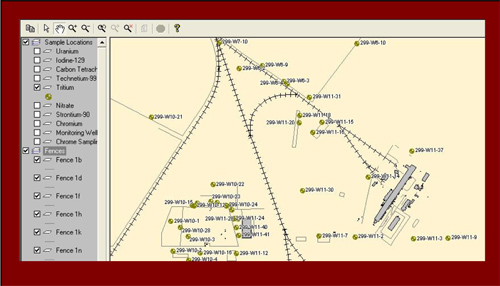
Monitoring stations associated with the environmental and also with the groundwater projects generally add up to thousands of wells. EDA provides easy options to select wells by project specific “areas of interest”.
Back to Top |
|
| |
| |
| |
| |
| |
| |
|
|
|
| Copyright © 2024
by EWM Group. All Rights Reserved.
|
|